The Dashboard is your central control panel in Kejarent. It gives you a quick visual summary of all critical insights across your properties - from occupancy statistics to revenue performance and utility usage. Each card, chart and table provides real-time data to help you make informed management decisions.
Here’s what you’ll find on the dashboard:
- Total Apartments & Units: View all apartments in your portfolio, including the number of occupied and vacant units.
- Revenue Overview: Track your overall rental revenue through charts and monthly summaries.
- Meter Accounts: See how many water/electricity meters are active and inactive, ensuring you can monitor utilities accurately.
- Arrears Summary: Instantly view total arrears - broken down into rent arrears and water arrears - to track outstanding balances.
- Current Month Performance: Check rent charged, rent collected and rent outstanding for the ongoing month.
- Water Consumption Trends: Visualize water usage over the last week, last month, last six months and last twelve months.
- Collection Insights: Access similar trend graphs for meter collections and rent collections to compare performance over time.
The dashboard is interactive and automatically updates as new data is added - giving you a live snapshot of your business at any time. Each metric links to a detailed module (e.g., clicking on “Apartments” opens the apartments page with all results). This makes it easy to drill down into specifics without navigating through multiple menus.
Below is a preview of how your Kejarent Dashboard appears:
This top section of the dashboard provides a summarized view of your property performance. You can quickly see total apartments, units and the number of occupied and vacant units. It also shows total revenue, total arrears and active meter accounts - helping you keep track of everything at a glance. To switch from light to dark mode, simply click the moon icon at the top right corner of the dashboard.
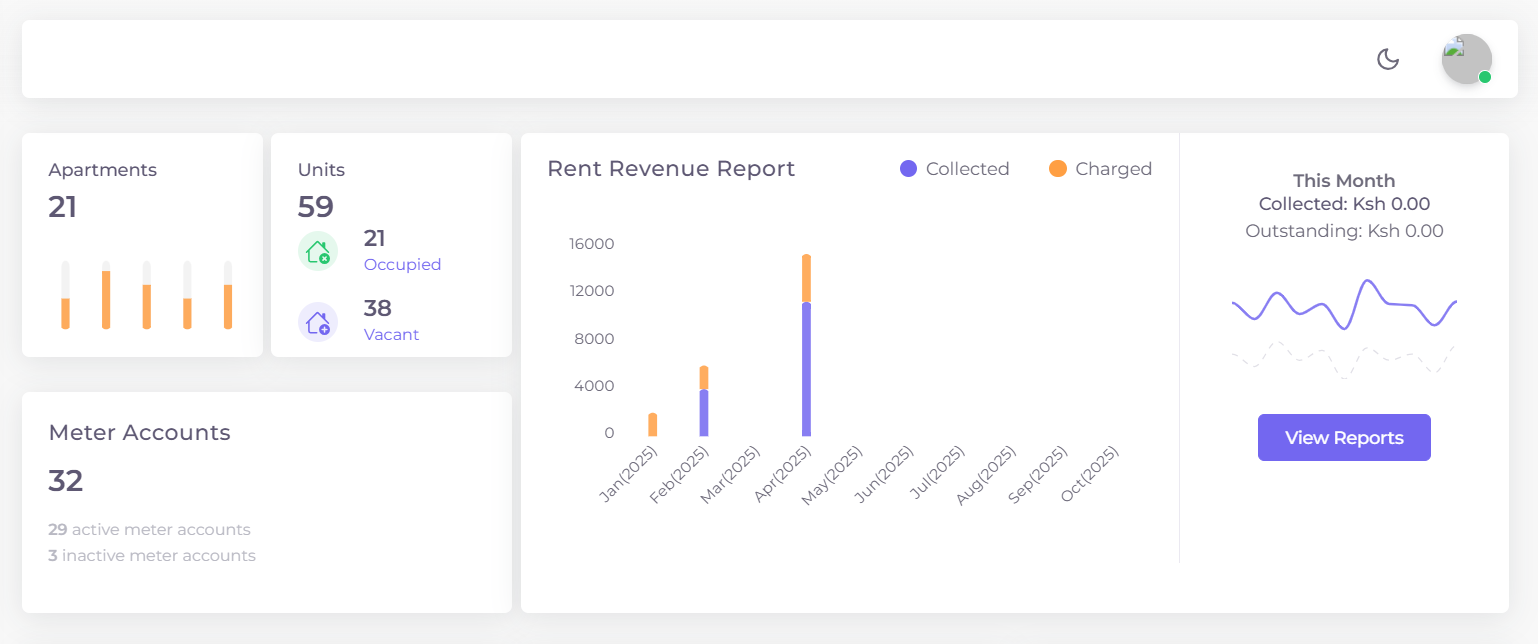
Figure 1: Kejarent Dashboard overview showing total apartments, units - how many are vacant and the occupied ones and revenue report
You can quickly see total arrears, rent charged, rent collected, outstanding rent, the water usage in ltrs - all in one place. This section provides a snapshot of your financial health and helps you identify any areas that need attention
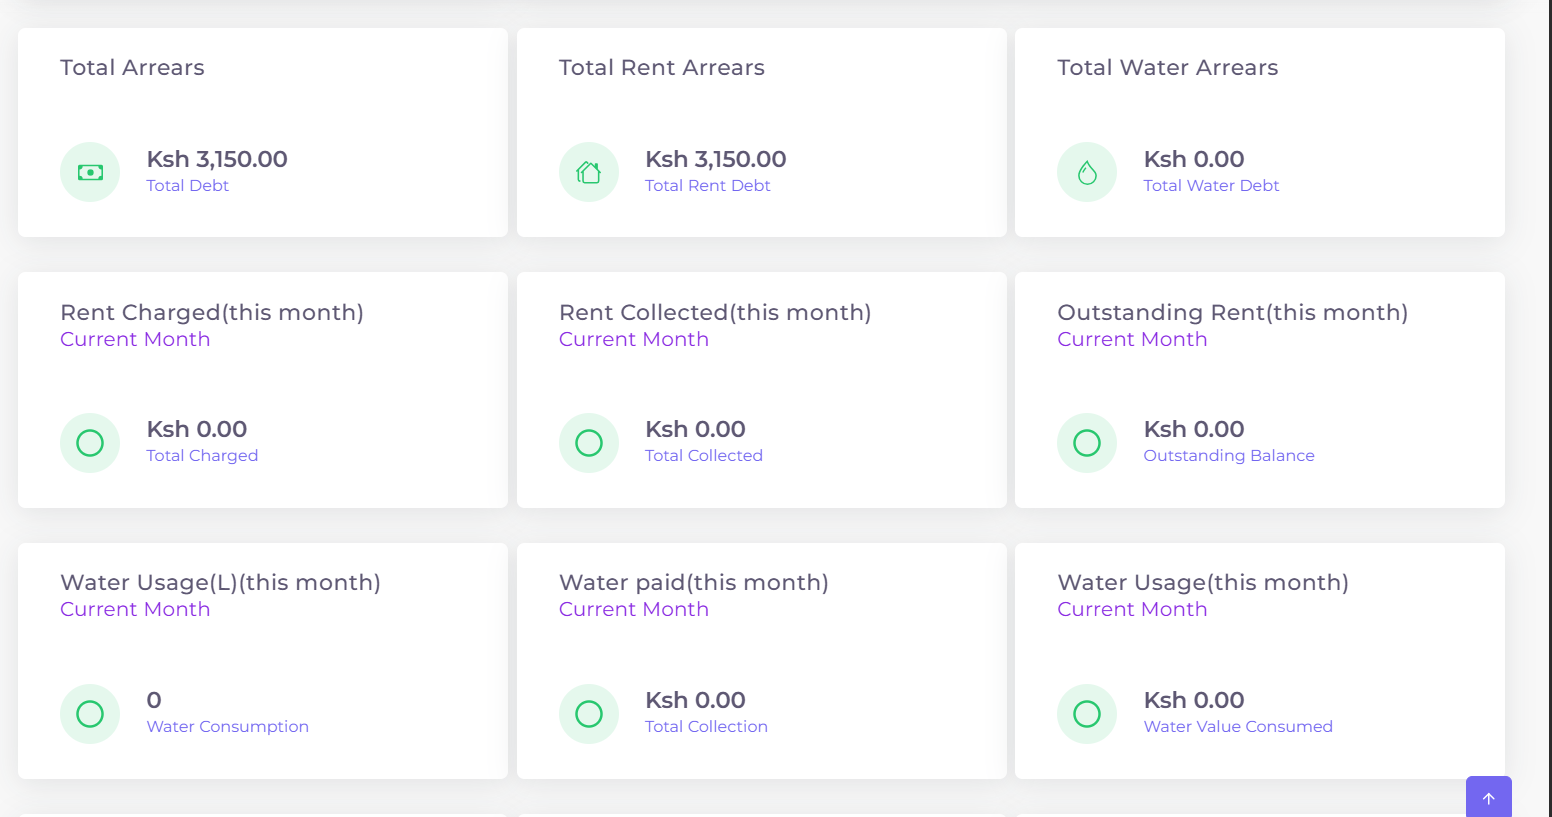
Figure 2: Summary cards showing total arrear, rent charged, rent collected and outstanding rent.
The revenue section helps you understand your current month’s rent performance — including rent charged, rent collected, and outstanding rent. You can also see water and meter collections, providing a clear breakdown of how much has been received and what’s pending.
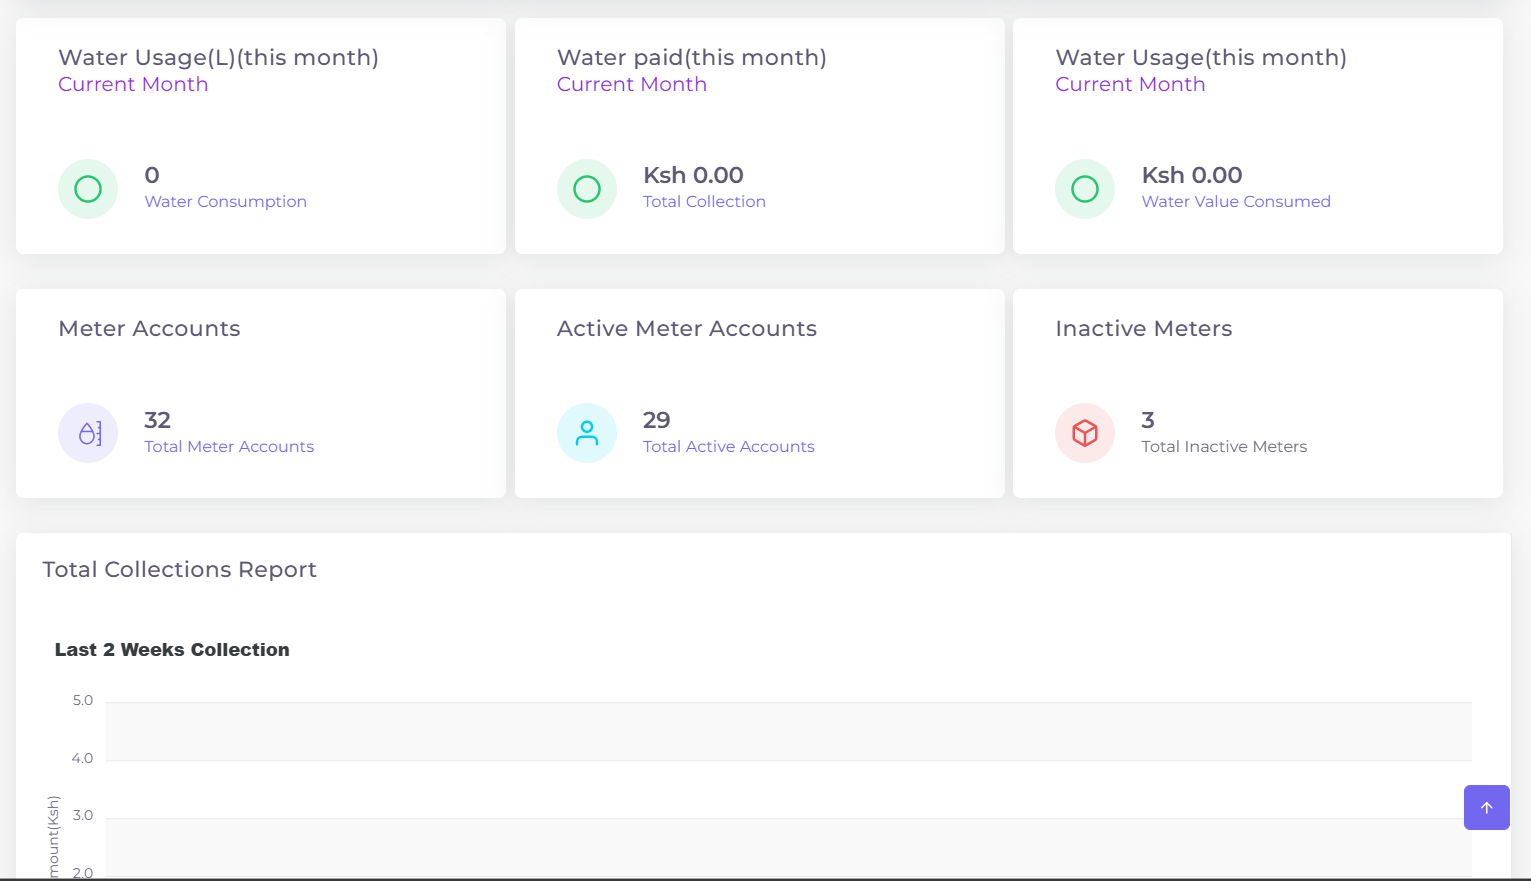
Figure 3: Monthly summary of water usage, water paid (this month), Mtrs - how many are active and inactive.
The water consumption and meter collection section provide an overview of usage trends over different time periods - including the last one week, month, six months and twelve months. These insights help you identify patterns and manage resources efficiently.
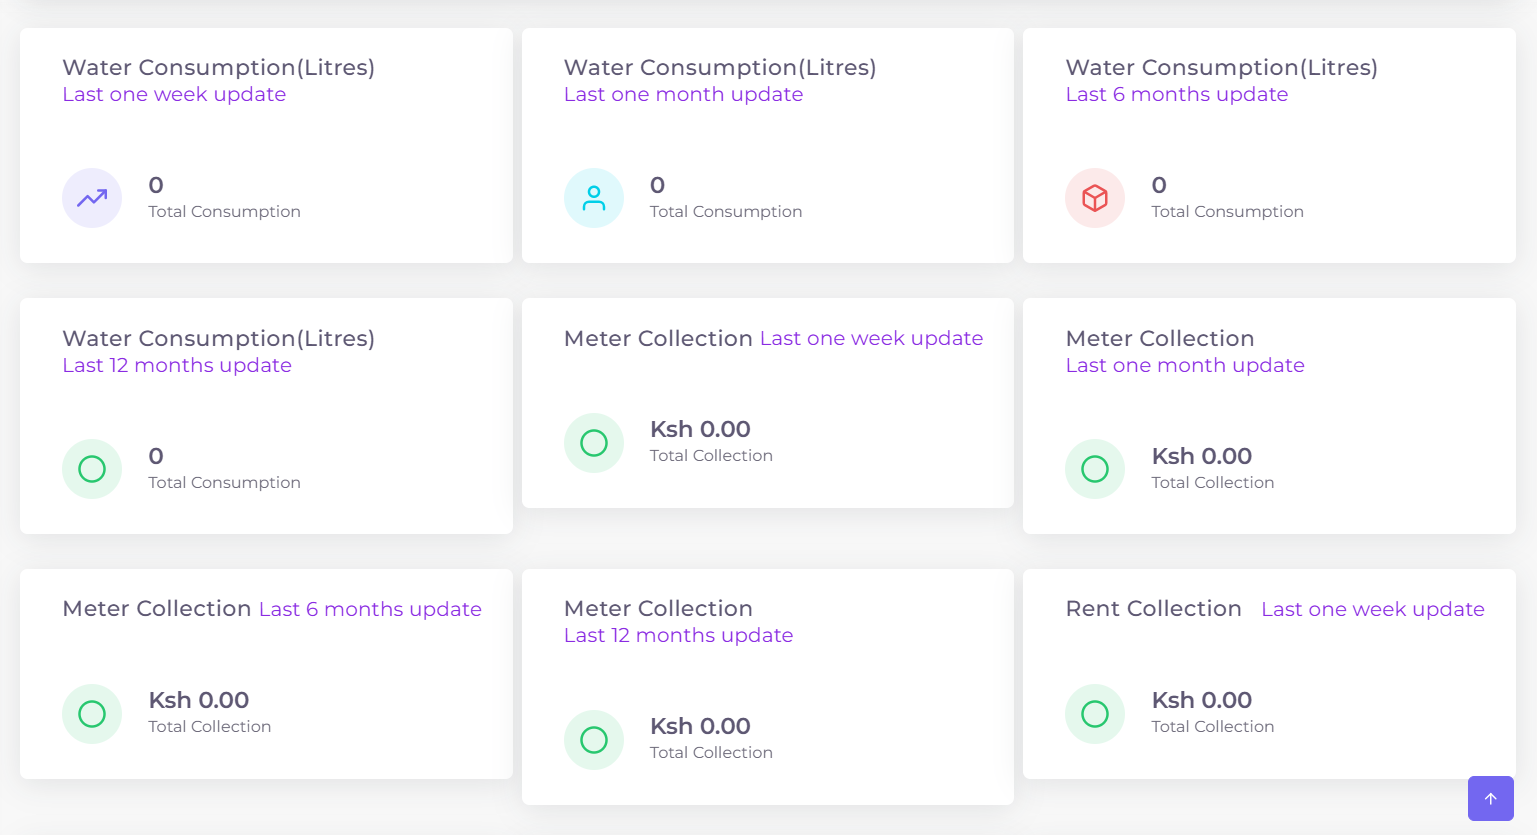
Figure 4: Summary cards showing water consumption over various timeframes and meter collection.